With or Without You
By Keith Goldner
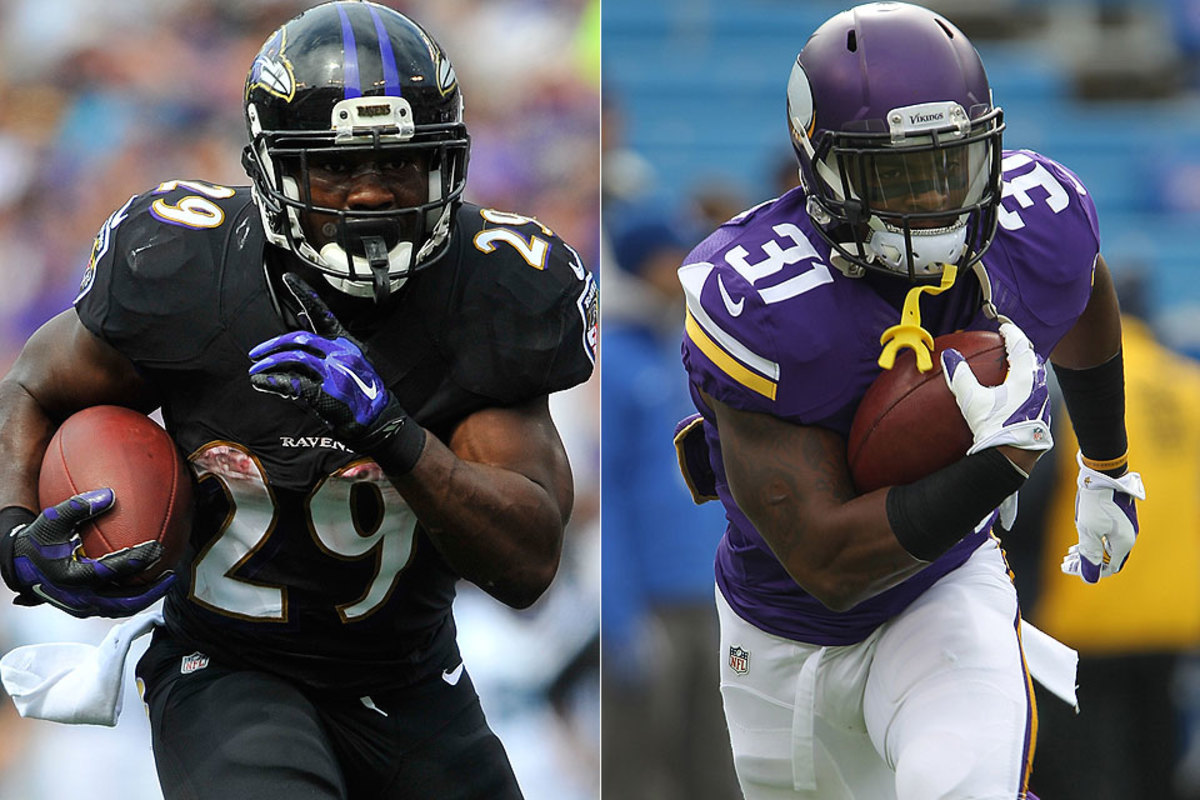
Adrian Peterson and Ray Rice haven't played this season due to domestic issues. They were both once the primary focus of their respective offenses. It's a difficult task for a team to replace its franchise running back.
For Minnesota, they turned to its big back, Matt Asiata, and eventually put the ball in the hands of the freakishly athletic rookie, Jerick McKinnon.
Baltimore already had a young backup ready to play in Bernard Pierce. But due to injuries and poor performance, the Ravens also used a committee approach, with Justin Forsett leading the way and Lorenzo Taliaferro getting reps too.
Have these teams done a good job replacing their primary ball carriers? And how much better or worse would they be with Peterson and Rice on the field?
To evaluate players and teams, we look at their efficiency so far using our internal metric, Net Expected Points (NEP). A quick refresher on NEP:
Rice vs. The NFL
The biggest matchup in football this week might be taking place in a New York City law office. Andrew Brandt breaks down the Ray Rice suspension appeal and how the NFL will defend it.
FULL STORY

NEP compares every single play over a season to how a league-average team should perform on that play. Every situation on a football field has an expected point value; that is, how many points an average team would be expected to score in that situation (given down, distance-to-go and yard line). For example, the Chiefs may be playing the Steelers, facing a third-and-two on the 50. That’s a ton of variables, but numberFire has data from the past dozen years of every single play, so most situations have come up at least once. According to our data, an average team may be “expected” to score 1.23 (estimated number) points on that drive. However, Jamaal Charles reels off a 32-yard run to bring the Chiefs into the red zone, increasing the “expected” point value of the next play to 4.23 (still an estimated number) points. Jamaal Charles then gets credit for the difference, in this case 2.96 points, as his NEP total. That’s Net Expected Points.
One extremely important note is this: Running the ball in today’s NFL is much less efficient than passing the ball. As a result, most—but not all—running backs actually detract from their teams’ production, while their quarterbacks gain those points back through the passing game. Only the most efficient runner will be able to stay above the fold.
Another caveat to this is that backups and third-down running backs tend to be more efficient than starters. This is not necessarily because they are better runners (they aren’t usually), but due to situational factors and defensive schemes. When a starting running back is in the backfield, teams will key in on him and pack the box. When a backup or third-down back is in, the defenses don’t expect the run; those running plays tend to be more successful.
Now, on to the specific backs.
Minnesota Vikings
Adrian Peterson (Jonathan Daniel/Getty Images)

Adrian Peterson is one of the best running backs in the NFL over the past decade. In each of his seven seasons, Peterson carried the ball at least 200 times and maintained a run success rate over 40%. For reference, the average success rate among running backs this season with at least 50 carries is 41.5%. AD has added points to the Vikings offense in five of his seven years, the pinnacle of which was in 2012 when he returned from injury to win the MVP. That year, Peterson added +36.3 NEP on 310 carries for +0.10 NEP per rush, not to mention 2,097 rushing yards.
Vikings Replacements
Matt Asiata (+0.05 Rush NEP, 40.5% Success Rate)
Jerick McKinnon (+0.61 Rush NEP, 41.1% Success Rate)
Both McKinnon and Asiata have essentially been perfectly average in terms of offensive production—again, that means they’ve been above average in terms of rushing efficiency. The truth is, the Vikings’ offensive production hasn’t fallen off dramatically without Adrian Peterson.
If we compare both runners with our projection for a full Adrian Peterson season, Peterson would add approximately 10 more points to the Vikings offense on the ground, and 4 fewer through the air. That means that, with Peterson over the course of the entire season, the Vikings would be expected to score one more touchdown. Based on a regression of our efficiency metrics against team wins, six points equates to approximately 0.16 wins.
Value of Replacements: -6 Points, -0.16 Wins
Baltimore Ravens
The case of the Ravens is a lot trickier. Ray Rice hasn’t been nearly as consistent as AD, and to make things more difficult, Rice and Bernard Pierce made up the league’s worst rushing offense in 2013 after an extremely successful 2012 season.
Rice finished 2013 with -38.5 rushing NEP and a career low +3.0 receiving NEP. That means that, on his touches, the Ravens sacrificed approximately five touchdowns over the course of the season—that’s almost one full win.
Ray Rice (Rob Carr/Getty Images)

Not including this outlier of a year, Ray Rice has added an average of +0.3 rushing NEP per season and has really excelled in the receiving game, adding +30.9 receiving NEP per season. Don’t let 2013 fool you: Ray Rice has been a great offensive asset in the NFL.
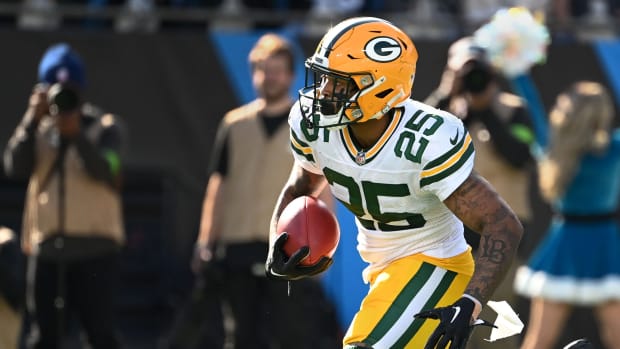
Ravens Replacements
Justin Forsett (+12.9 Rush NEP, 46.0% Success Rate)
Lorenzo Taliferro (-2.0 Rush NEP, 44.8% Success Rate)
Bernard Pierce (-6.9 Rush NEP, 42.9% Success Rate)
John Harbaugh has gone with the hot-hand committee approach, and Justin Forsett has separated himself as the top rusher. Forsett’s +12.9 rushing NEP is No. 2 in the entire NFL behind only Mark Ingram (+19.2), and although Forsett has historically been a league-average rusher, he has also performed admirably in the passing attack, adding about +13.2 receiving NEP per season (he is currently third among all Ravens in receptions at 31).
Taliaferro has been a decent change-of-pace back, putting up league-average production, but not adding anything to the offense other than avoiding the plague of Bernard Pierce. After a great rookie year, Pierce has been unable to find room and has already cost the Ravens a full touchdown on his carries.
Combining the committee’s production, we project that the Ravens will actually score about three more points than they would with Ray Rice in the backfield, or approximately +0.08 wins. As mentioned, though, Rice is much more variable than Adrian Peterson, especially coming off the miserable season. If Rice performed the same as last year, the Ravens would be expected to win two less games than with their current motley crew.
Last year, they went 8-8. And based on their efficiency, we project they should have won an estimated 7.1 games. We currently project them to win 9.1 games in 2014—exactly two more wins.
Value of Replacements: +3 Points, +0.08 Wins
Keith Goldner is the chief analyst at numberFire.com, the leading fantasy sports analytics platform. Follow him @keithgoldner.
[widget widget_name="SI Newsletter Widget”]